Nobody fully trusts the first report they open in the morning — ask any operator who's carried a category P&L and they'll tell you the same thing, they just don't usually say it out loud. You know this morning: shipments load first, and you key them into the spreadsheet tracking your objective, your funding, your trade spend. Then a second report to see where share and TDPs actually stand. Then a third for something else. By the time you've rolled it all into an on-track/off-track read for your manager, you've stitched together your own business from four or five systems that don't agree with each other.
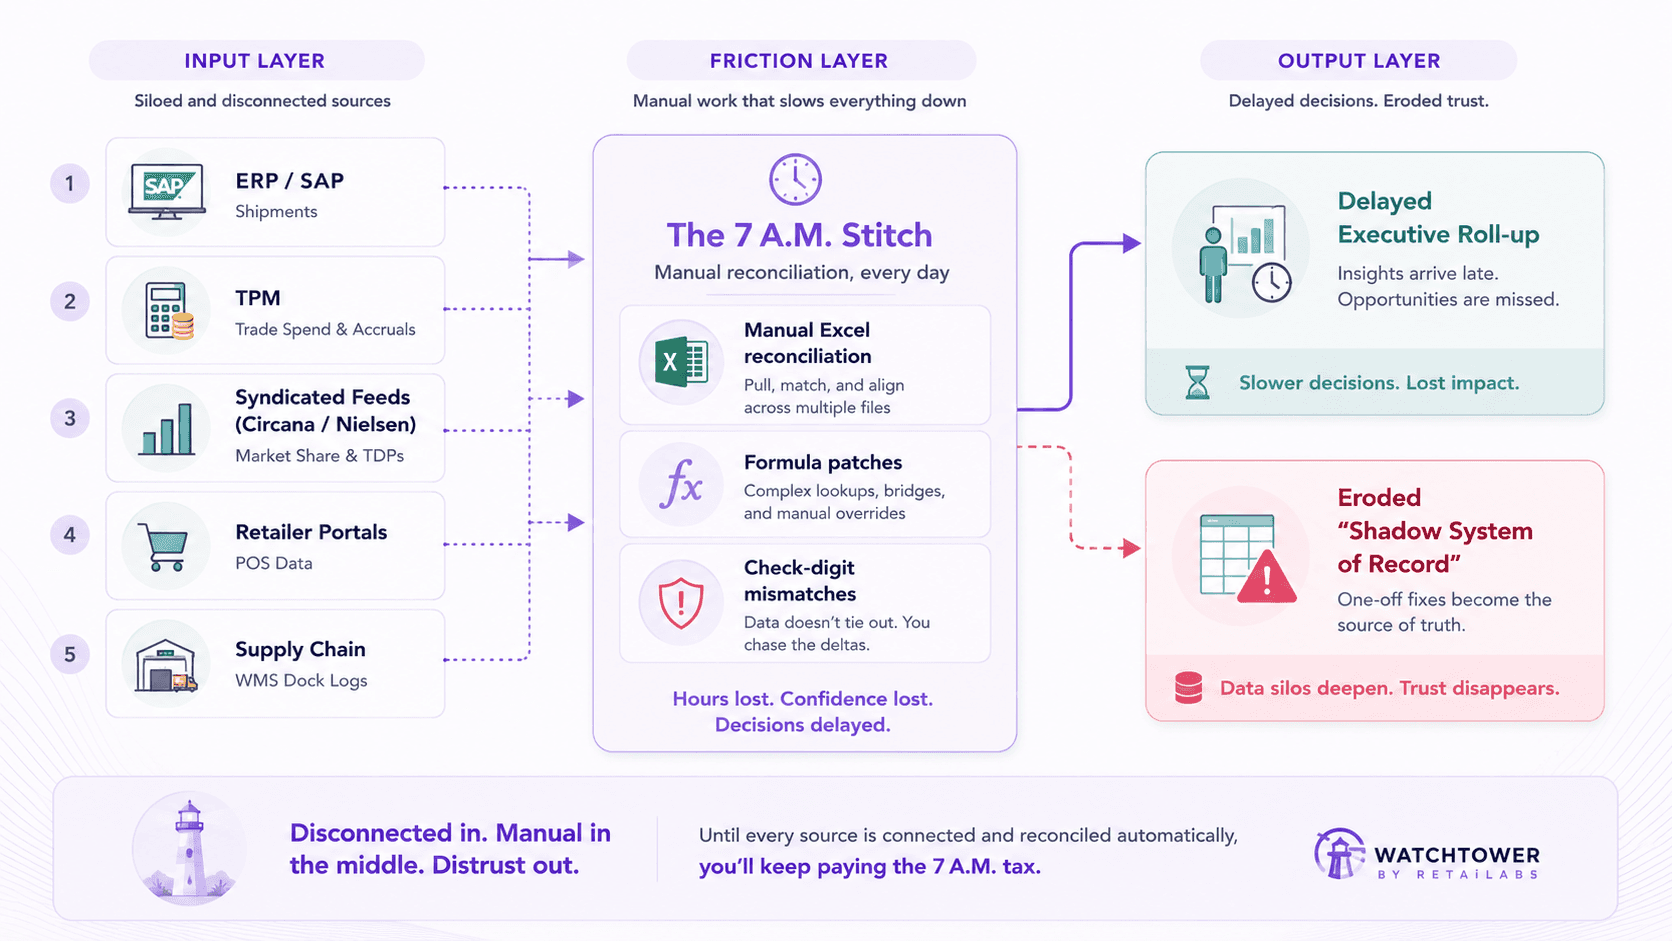
This isn't a scrappy-startup problem. It happens at the most sophisticated CPG companies in the world, with real tech budgets and genuinely excellent teams. The tools were just never built to be one system — they were built to be five systems an operator reconciles by hand, every morning, before the first meeting.
It also doesn't stay contained to one person's morning. Multiply it across a portfolio of brands, a dozen priority retailers, and a category team of fifteen people, and the reconciliation ritual becomes an invisible tax line nobody has ever actually put a number on. One category director we spoke with estimated her team spent close to a full workday, collectively, every week, just getting different systems to agree on the same growth number before anyone touched strategy.
The Tell
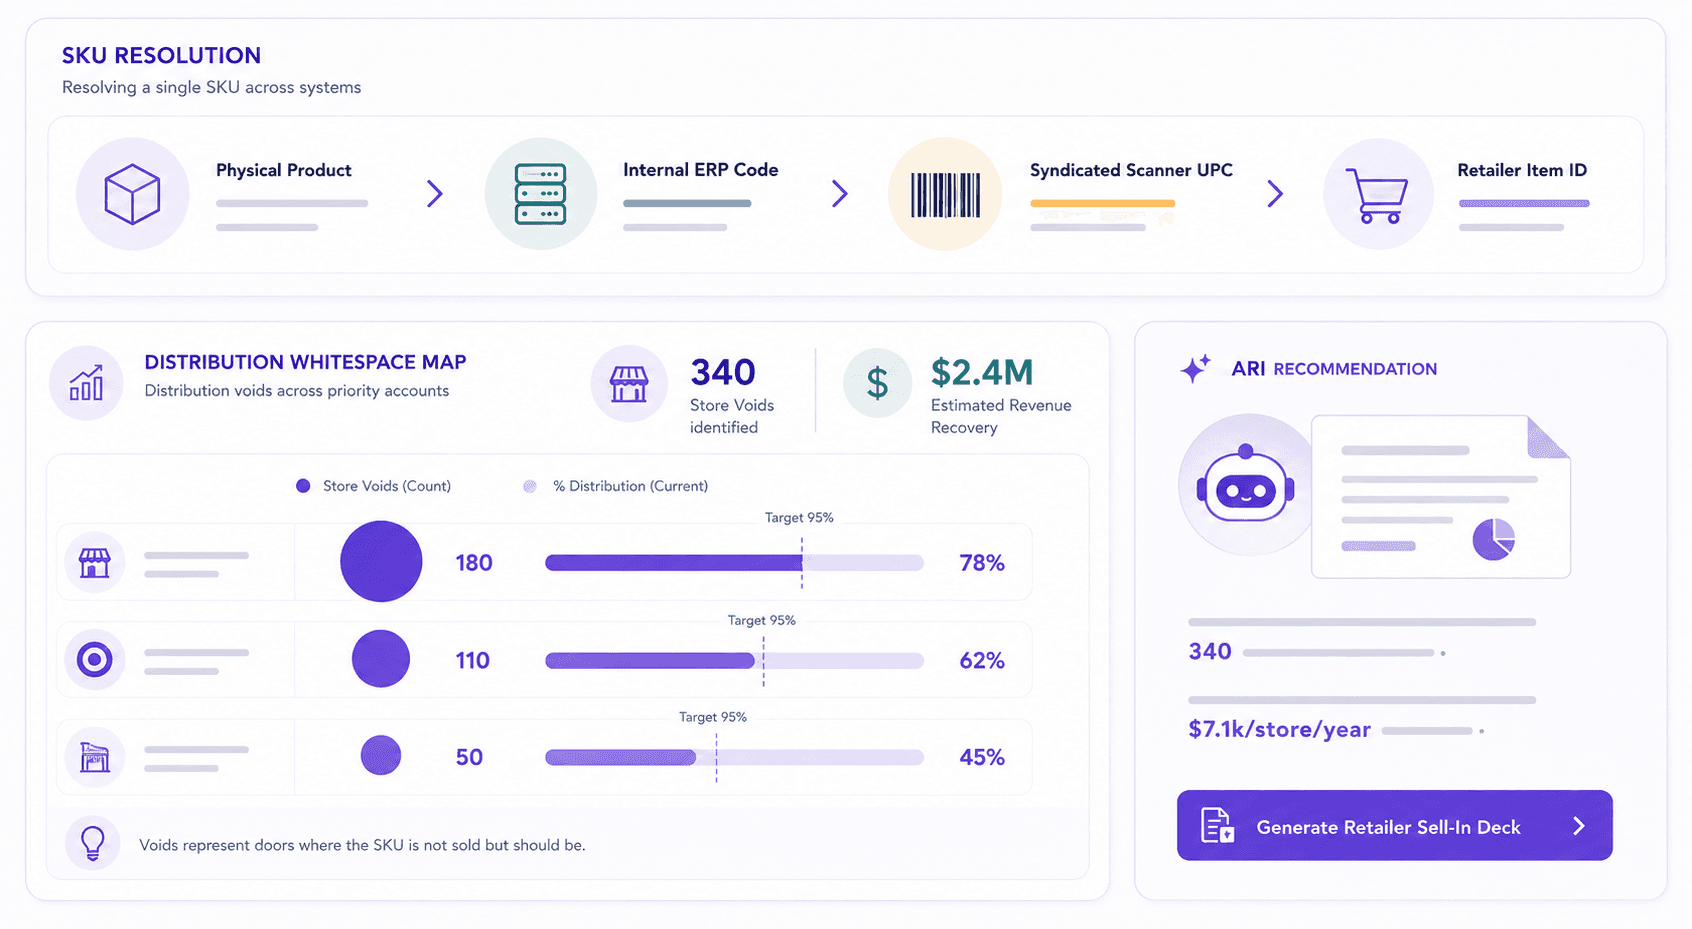
Run this test before you buy anything: ask two people to pull the same SKU's shipment number from two different systems. If they don't land on the identical answer without someone manually reconciling it first, you don't have a dashboard problem. You have an identity problem — and no chart fixes that.
It shows up everywhere once you look for it. A UPC, an internal item code, and a retailer item ID that don't automatically agree. A truck that doesn't leave the dock because a check digit is off. A "growth number" with three different versions floating around, and nobody quite sure which one is right. It's also the tell for a deeper habit: most commercial teams are quietly running on shadow spreadsheets — the real system of record — because the official ones don't add up on their own.
You don't have a dashboard problem. You have an identity problem — and no chart fixes that.
The uncomfortable part is that this rarely shows up as a dramatic failure. It shows up as a slow erosion of confidence — a category review where two slides show two different share numbers, a forecast nobody fully believes, a habit of quietly double-checking anything that matters before it goes in front of a retailer. Trust, once it's this fragmented, doesn't come back just because someone builds a nicer chart on top of it.
A Framework Isn't a System
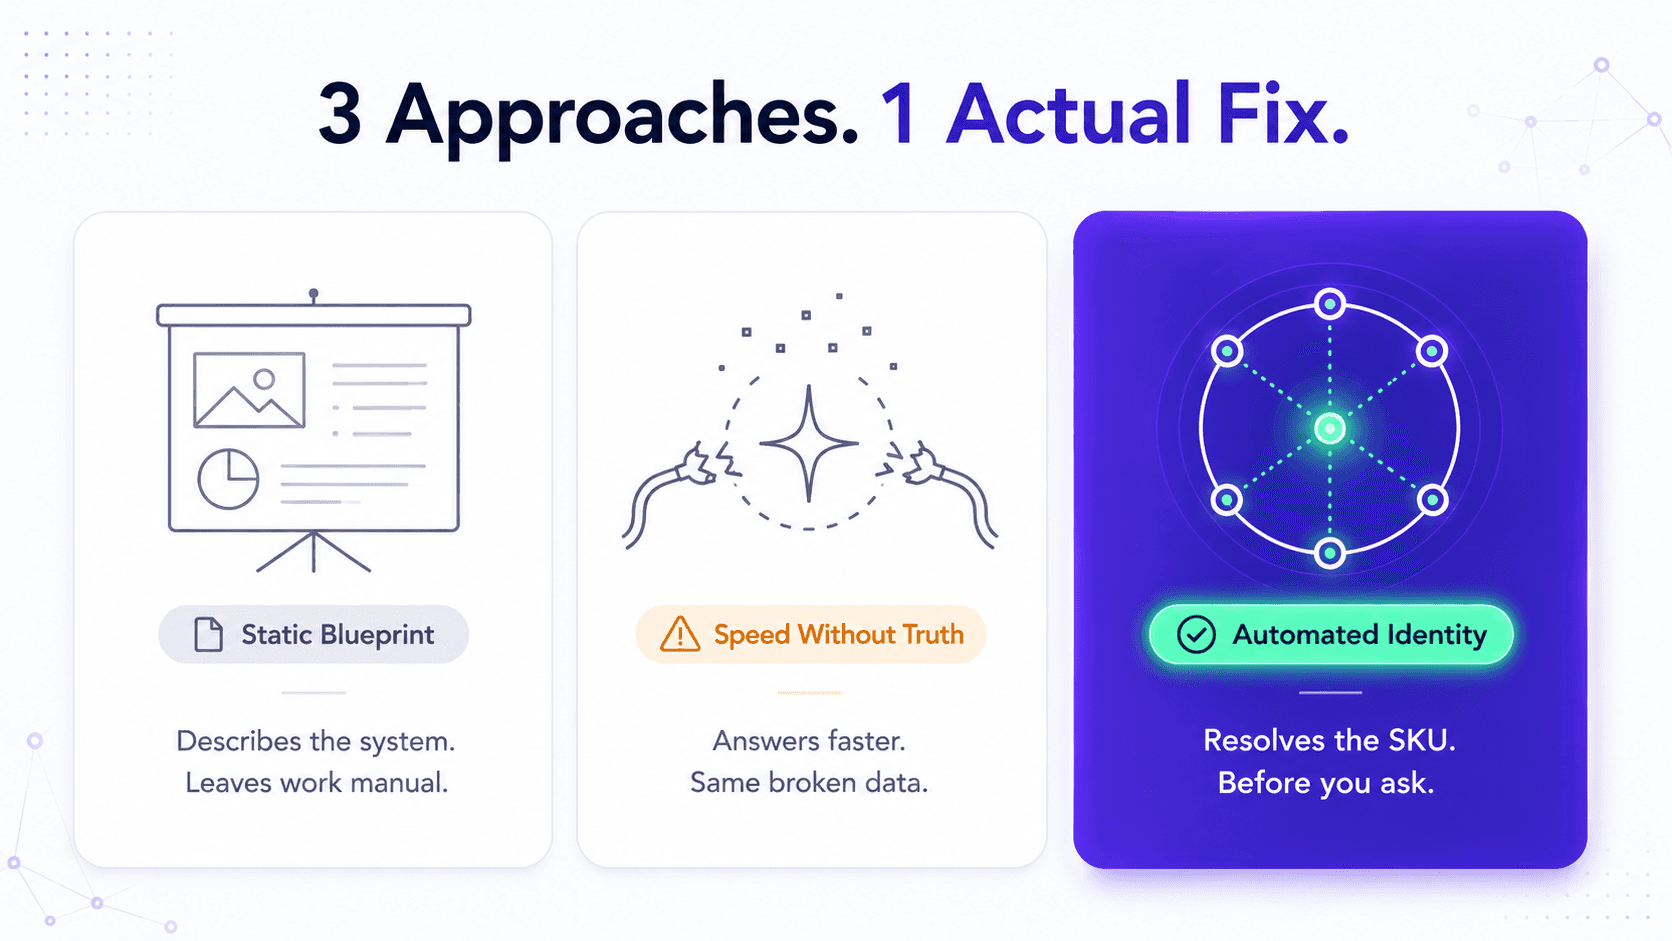
Two kinds of help typically show up here, and neither actually closes the gap.
A consulting engagement will hand you a target-state architecture — genuinely useful in the workshop, and a static document the moment the engagement ends. "We got a beautiful deck on how our data should flow," one operations lead told us. "Eighteen months later, we were still pulling the same five reports by hand." A framework describes a system. It doesn't build, maintain, or keep earning trust in one.
A generic AI copilot has the opposite problem: it moves fast, but on the same broken foundation. It will summarize a spreadsheet faster than any analyst can. What it won't do is know that the SKU in your syndicated feed, the SKU in your SAP shipment file, and the SKU your buyer references by a completely different item number are all the same product. A copilot layered on top of unresolved, fragmented data doesn't fix the trust problem — it just answers your questions faster, with the same wrong assumptions quietly baked in.
Both approaches skip the actual first problem: nobody has built one commercial context model where a SKU is the same SKU everywhere, before a human opens a single tab.
Where CCOP Actually Starts
This is deliberately where CCOP starts — not with a dashboard, but with one identity graph resolving item codes and retailer IDs to each other automatically, so the numbers are reconciled before anyone asks a question. Growth metrics like index-to-plan and index-to-prior-year get computed once, correctly, off that same resolved foundation — not stitched together by hand five different ways across five different teams.
And because it's an orchestration layer, not a rip-and-replace system, it sits on top of SAP, your TPM, your syndicated feeds — reading what's already there instead of asking you to re-enter it somewhere new. The commercial brain isn't a new place to put your data. It's the layer that finally makes your existing systems agree with each other.

Fix the Identity, Not the Dashboard
Don't ask your team if they need better dashboards. Ask how many people, this week, manually re-typed the same shipment number into a second tool because they didn't trust the first one. Multiply that by their fully loaded cost, every week, forever. That's the trust tax you're paying to avoid building one identity graph — and it's usually a lot more expensive than fixing it.
You don't have to fix everything at once, either. Apply the same 80/20 discipline your best operators already use on their accounts: start with the tier-one relationships driving the bulk of your rooftop volume, get their identity resolved and their numbers trustworthy first, and let the rest follow. The commercial brain doesn't get built in a quarter. But the 7 a.m. spreadsheet ritual can end a lot sooner than most C-suites think.
Facing the same reconciliation problem? Let's look at it together — book time on Calendly or drop a line to lisa@retailabs.ai.